
“Core Web Vitals” sounds like something only a developer needs to worry about. It isn’t. It’s just Google’s way of measuring how fast and steady your website feels to a real person, and it affects both your ranking and your sales. Here’s the plain-English version.
What Core Web Vitals actually are
Google can’t sit next to every visitor and watch them use your site, so it measures three specific things that add up to “does this page feel good to use.” Those three measurements are the Core Web Vitals. Each one has a target you want to hit, and each one maps to a moment a visitor actually experiences.
- LCP — how long until the main thing on the page shows up.
- INP — how quickly the page reacts when you tap or click.
- CLS — how much the page jumps around while it loads.
That’s the whole idea. Now the details, one at a time.
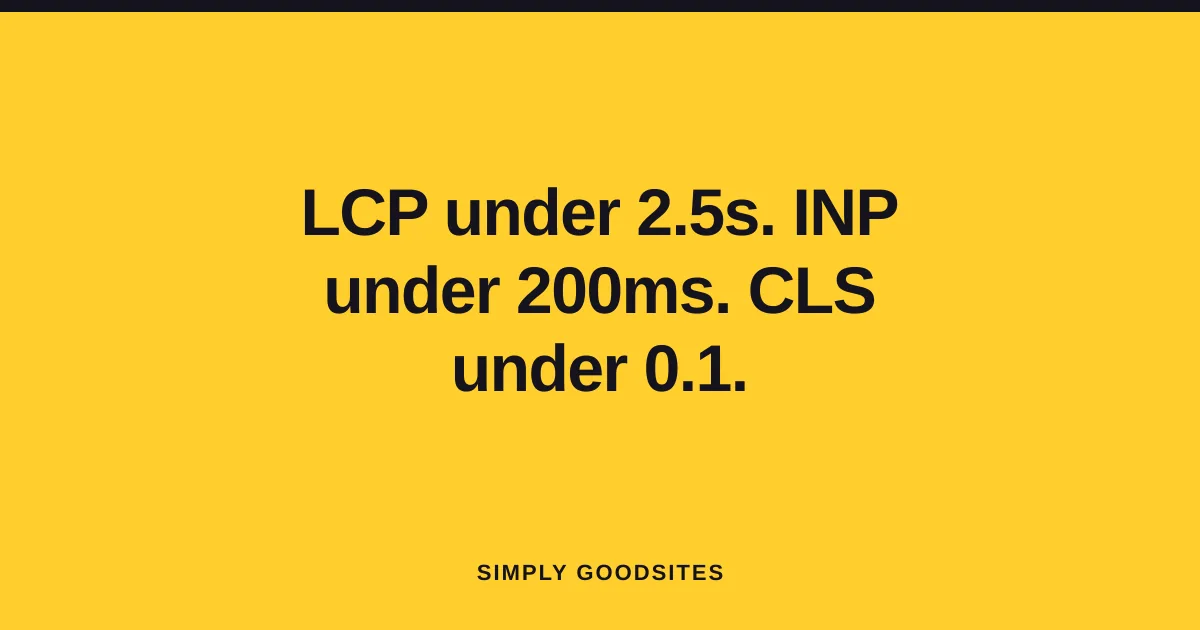 The targets to aim for: LCP under 2.5s, INP under 200ms, CLS under 0.1.
LCP: how fast the main content shows up
LCP stands for Largest Contentful Paint. In plain terms: how long does it take for the biggest, most important thing on the screen (usually your headline or hero image) to actually appear?
Think of it like a waiter at a restaurant. You don’t mind a short wait, but if you’re sitting there for ten seconds before anyone even brings water, you start eyeing the door.
The target: under 2.5 seconds. Above that, visitors start to feel the wait.
Common causes of slow LCP:
- Huge, unoptimized images. A hero photo straight off a camera can be several megabytes and takes forever to paint.
- Slow or overloaded hosting. Cheap shared hosting makes every visitor wait in line.
- Heavy code loading before the content. Scripts and styles that block the page from rendering.
Fixes: compress and resize images, move to hosting that isn’t crammed with thousands of other sites, and strip out code that isn’t needed. We cover the full list in why is my website so slow.
INP: how fast the page responds to you
INP stands for Interaction to Next Paint. It measures responsiveness: when you tap a button, open a menu, or click “add to cart,” how quickly does the page actually react?
Imagine flipping a light switch and the light coming on half a second later. It still works, but it feels broken. That lag is exactly what INP catches.
The target: under 200 milliseconds. That’s fast enough that a tap feels instant.
Common causes of poor INP:
- Too many scripts running at once. Chat widgets, tracking pixels, and page-builder code all compete for your phone’s attention.
- Heavy, bloated templates. Drag-and-drop builders often load a lot of general-purpose code that clogs things up.
Fixes: remove third-party scripts you don’t truly need, and build on a lean foundation instead of a bloated one. This is one reason we favor fast, static-first builds — there’s simply less code getting in the way.
CLS: how stable the page stays
CLS stands for Cumulative Layout Shift. It measures visual stability: does the page hold still as it loads, or do things jump around under your finger?
You’ve felt this one. You go to tap a link, an ad or image loads above it, everything shifts down, and you tap the wrong thing. Annoying, and sometimes costly — imagine that happening on a “Buy” button.
The target: under 0.1. The lower the number, the steadier the page.
Common causes of layout shift:
- Images and ads without reserved space. The browser doesn’t know how big they’ll be, so it shoves everything else around when they arrive.
- Fonts that load late and re-flow the text.
- Content injected after load, like banners or pop-ins.
Fixes: set explicit dimensions for images so the space is held before they load, and avoid dropping content in after the page has settled.
How to check your own scores
You don’t have to guess. Two free Google tools tell you exactly where you stand:
- PageSpeed Insights. Paste in your web address and it grades all three vitals, on mobile and desktop, plus a specific list of what’s dragging you down. Under 50 overall is a problem; 90+ is the goal.
- Google Search Console. Its Core Web Vitals report shows how real visitors are experiencing your site over time, grouped into “Good,” “Needs improvement,” and “Poor.” This is the closest thing to seeing your site through your customers’ eyes.
Run both. PageSpeed tells you what to fix; Search Console tells you whether real people are actually feeling the problem.
Why this matters for your business
Core Web Vitals aren’t just a technical badge. They hit you in two places that matter.
Ranking. Google uses these metrics as a ranking signal. When two local businesses are otherwise similar, the faster, steadier site gets the edge in search results. For anyone competing on local SEO, that’s free ground you don’t want to give away — it’s a core part of how we approach SEO.
Conversions. Speed isn’t only about Google. Google’s research found that 53% of mobile visitors abandon a page that takes more than 3 seconds to load. A poor LCP means half your mobile visitors are gone before they read a word. A jumpy CLS makes them mis-tap and give up. Good vitals keep people around long enough to become customers.
This is also why the platform you build on matters so much. A lean, well-built site hits these targets by default; a heavy template fights them the whole way. We dig into that trade-off in WordPress vs. custom. Our builds routinely score 90+ on PageSpeed because they’re engineered that way from the start, and because you own everything, with direct access to the person who built it, there’s no platform ceiling holding your scores down.
Lab data versus field data
One thing confuses almost everyone the first time they look: two Google tools report different numbers for the same page.
Lab data comes from a simulated test run right now, on a virtual mid-range phone with a throttled connection. PageSpeed Insights shows this at the top. It’s repeatable and useful for diagnosing, because it lists exactly what’s slow.
Field data comes from real visitors on real devices over the previous 28 days. Search Console reports this, and PageSpeed shows it when enough people have visited.
When they disagree, believe the field data. It’s what actual customers experienced, and it’s what Google uses for ranking. Lab data is a diagnostic tool, not a verdict.
This also explains a common frustration: you fix things, the lab score jumps immediately, and Search Console shows nothing for weeks. That’s expected. Field data is a rolling 28-day window, so it takes most of a month to reflect a change.
Why each one fails
Knowing which metric is failing tells you where to look, which saves a lot of wasted effort.
LCP is usually images. An oversized hero image is the single most common cause. Also: slow server response, render-blocking CSS, and fonts that delay the headline. Fix by resizing and compressing the largest visible image, then preloading it.
INP is usually JavaScript. Something heavy is running when the visitor taps, so the page can’t respond. On WordPress this is often plugin scripts loading on every page whether needed or not. Fix by removing what you don’t use and deferring what isn’t critical.
CLS is almost always missing dimensions. An image loads and pushes everything down. An ad slot expands. A font swaps and the text reflows. Fix by setting explicit width and height on every image and reserving space for anything that loads late.
That last one is worth emphasising because it’s the cheapest to fix and the most irritating for visitors. Everyone has tapped the wrong thing because a page jumped at the moment of contact.
Frequently asked
How much do Core Web Vitals affect rankings? They’re a confirmed factor, but a modest one next to relevance and content. Think of them as a tie-breaker between comparable results rather than a way to leapfrog better-matched pages. The bigger commercial effect is on conversion, since visitors who leave never convert regardless of position.
Do I need a perfect 100? No. Passing the thresholds is what counts: LCP under 2.5s, INP under 200ms, CLS under 0.1. Chasing the last few points is rarely worth the effort.
Why is my mobile score so much worse than desktop? Mobile tests assume a slower processor and network. That’s closer to what most of your visitors actually experience, which is why mobile is the score that matters.
My scores fluctuate between tests. Is something wrong? Lab tests vary run to run. Test three times and take the middle result, or rely on field data, which averages across thousands of real visits.
I have almost no traffic, so Search Console shows no field data. What then? Use lab data and aim comfortably past the thresholds. Field data appears once you have enough visitors.
Will a faster host fix my scores? It helps time-to-first-byte, which feeds LCP. It does nothing about a page carrying 6MB of images or heavy JavaScript. Fix the page first, then consider the host. See choosing web hosting.
The quick wins
Before anything technical, four changes fix most failing scores on most small business sites:
Resize and compress every image. Almost always the largest single gain, and it usually addresses LCP directly.
Set width and height on every image. Two attributes, and it eliminates the most common cause of layout shift.
Remove plugins and scripts you don’t use. Each one is code running on every page load, and most sites are carrying several nobody remembers installing.
Cut your fonts back. Two families, only the weights you actually use, with font-display: swap so text appears immediately rather than waiting.
None of these require a developer, and together they take an afternoon. Measure before and after so you know which one moved the number.
Frequently asked
Are Core Web Vitals the same on every page? No. They’re measured per page, and Search Console groups pages with similar problems. A fast homepage doesn’t excuse a slow service page, and service pages are often where the money is.
Does a CDN improve these scores? It helps LCP by shortening the distance data travels, particularly for visitors far from your server. It does nothing for oversized images or heavy JavaScript.
How often should I check? Monthly, and after any significant change. Scores regress quietly as photos get uploaded and scripts get added.
What to fix first
Core Web Vitals are just Google’s plain measure of whether your site feels fast, responsive, and steady. Aim for LCP under 2.5 seconds, INP under 200 milliseconds, and CLS under 0.1, and you’re giving both Google and your visitors what they want.
Want to know where your site stands and what’s holding it back? Get in touch for a straight answer, or see how we build for speed on our services page.
Want this handled for you?
SimplyGood builds fast, lead-generating websites for local businesses across the US. Get a tailored quote in one business day.